By Gina Mitchell
SVIA’s Annual Stable Value Investment and Policy Survey, its most comprehensive survey, confirmed the positive trends found in most defined contribution plan asset allocation and stable value investments surveys. The annual survey, which covers 38 stable value managers, reported that assets under management in 2012 had risen to $701 billion, which is up by 8.6 percent from 2011. Further, the annual survey found this increase was experienced by all three management segments: individually managed accounts, which generally cover large plans, grew by 2.9 percent, pooled funds, which generally cover small to mid-sized plans, grew by 0.8 percent, and life insurance company accounts, which cover all-sized plans with their product offerings, grew by 17 percent. Based on the annual survey, stable value comprised 14 percent of all defined contribution plan assets in 2012.
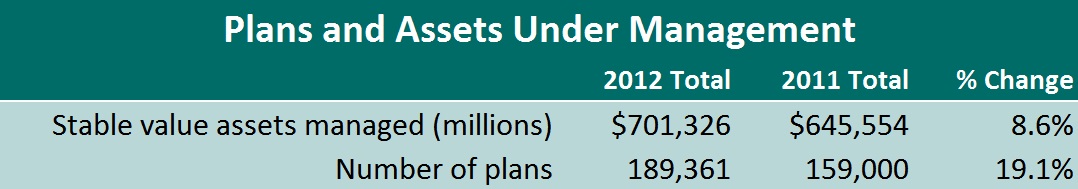
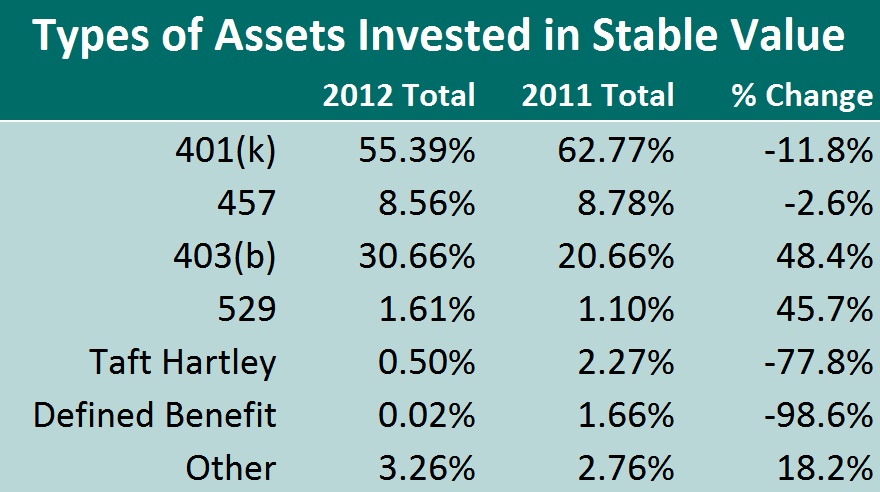
Plan assets in the survey were predominantly defined contribution plan assets with 401(k) at 55 percent, 457 plans at 8 percent, and 403(b) at 31 percent in 2012. The remaining 5.4 percent was comprised of other tax-deferred savings plans such as 529 tuition assistance plans, Taft-Hartley plans and defined contribution plans. Interestingly, 403(b) plans increased and 401(k) plans declined when compared to 2011 data. This can be attributed to the strong growth of the life insurance company accounts management sector as well as survey participation, since survey participants can vary from year to year.
The overall net return for stable value fell from 3.18 percent in 2011 to 2.97 percent in 2012, which reflects the declining interest rate environment. However, stable value returns still compare favorably to money market returns for the same period.
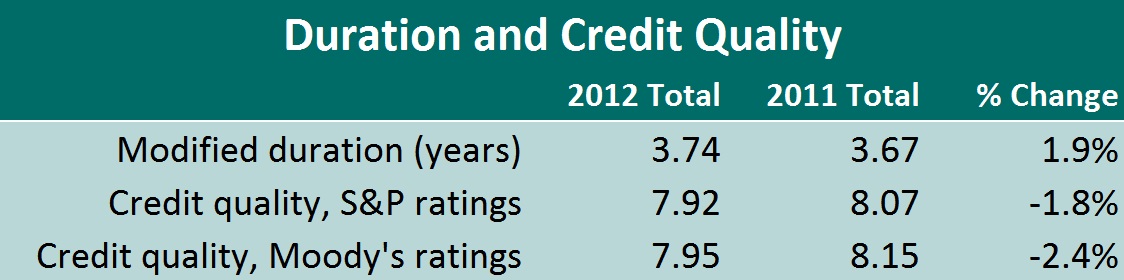
The annual survey reported similar trends as SVIA’s Quarterly Characteristics Survey with respect to some metrics, but not all. The annual survey found that the credit quality of the underlying investments decreased overall with survey participants reporting AA or Aa2 or better on average using both S&P and Moody ratings, whereas the quarterly survey shows credit quality edging upwards towards AA+ or Aa1. The annual survey also found that duration had increased from 3.74 years in 2012 from 3.67 in 2011, and the quarterly survey reported a similar trend. The variations can be attributed to the fact that the annual survey covers both a larger and broader array of stable value products, whereas the quarterly survey covers 23 synthetic GIC stable value managers.
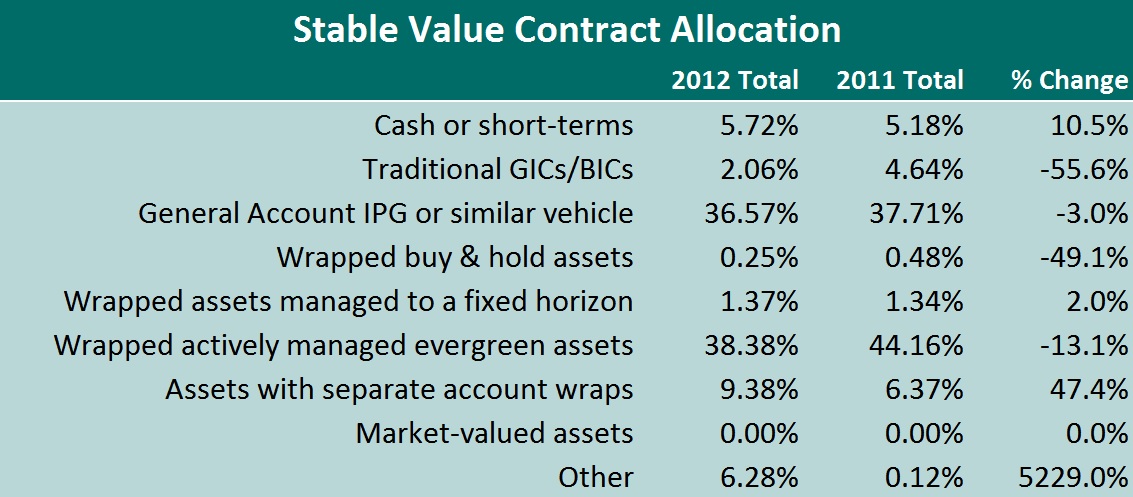
The annual survey found that the underlying portfolio allocation continued to vary based on the management segment. Overall the annual survey found that the average allocation in 2012 for stable value products was 5.7 percent in cash, 38.6 percent in GICs and general account products, as well as 49.4 percent in wrapped assets.