Stable value provides the following unique combination of benefits:
- Principal preservation
- Consistent, positive returns
- Liquidity for participant benefit payments
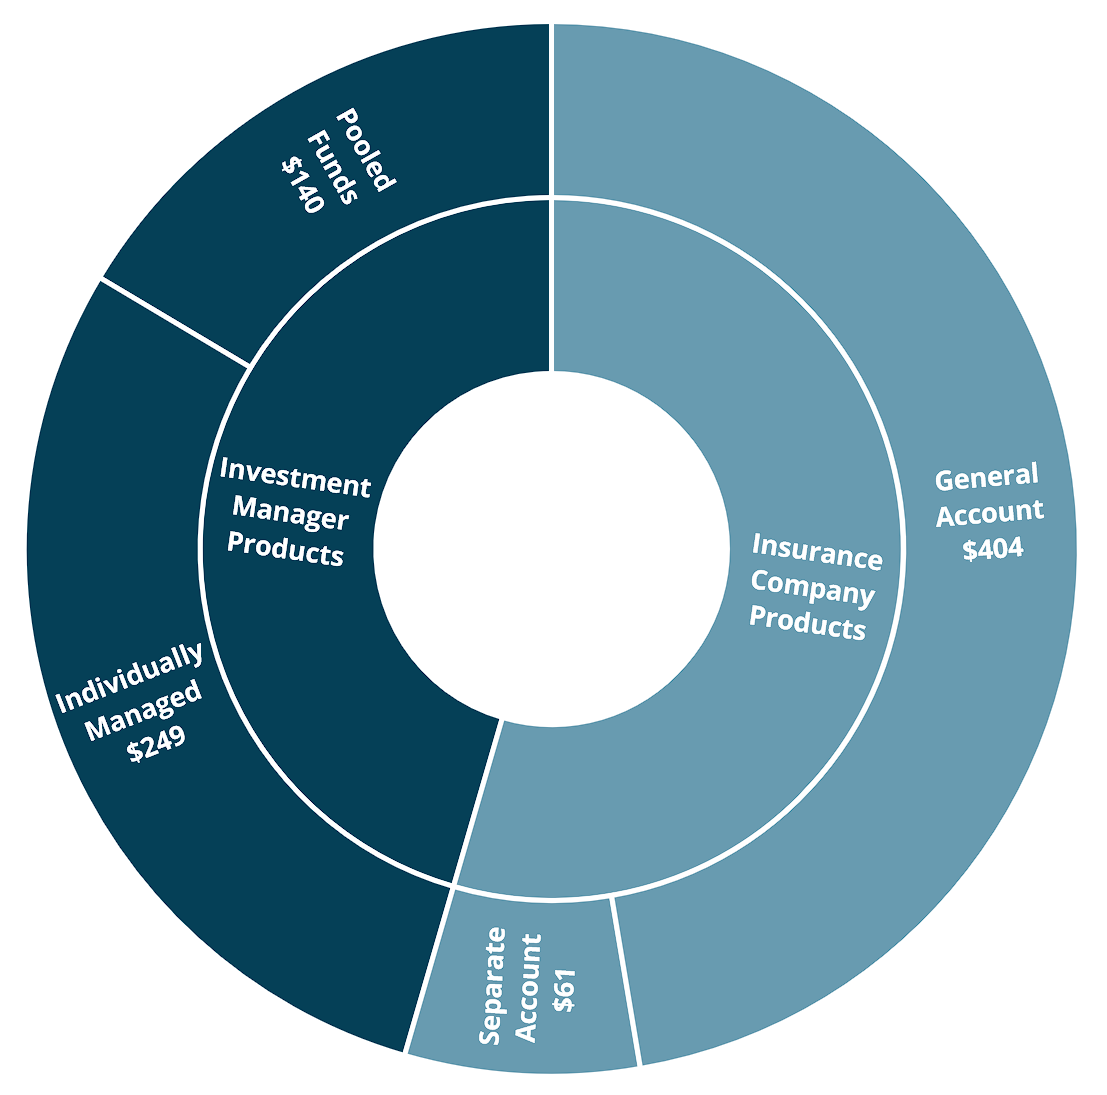
The stable value industry is $853.95 billion allocated across four types of stable value:
$854 Billion1 Invested in Stable Value as of 12/31/2025
Stable value is only available in tax qualified plans, most notably defined contribution plans, and is offered in approximately 3 out of 4 defined contribution plans according to the Alight Solutions Trends & Experience in Defined Contribution Plans survey.
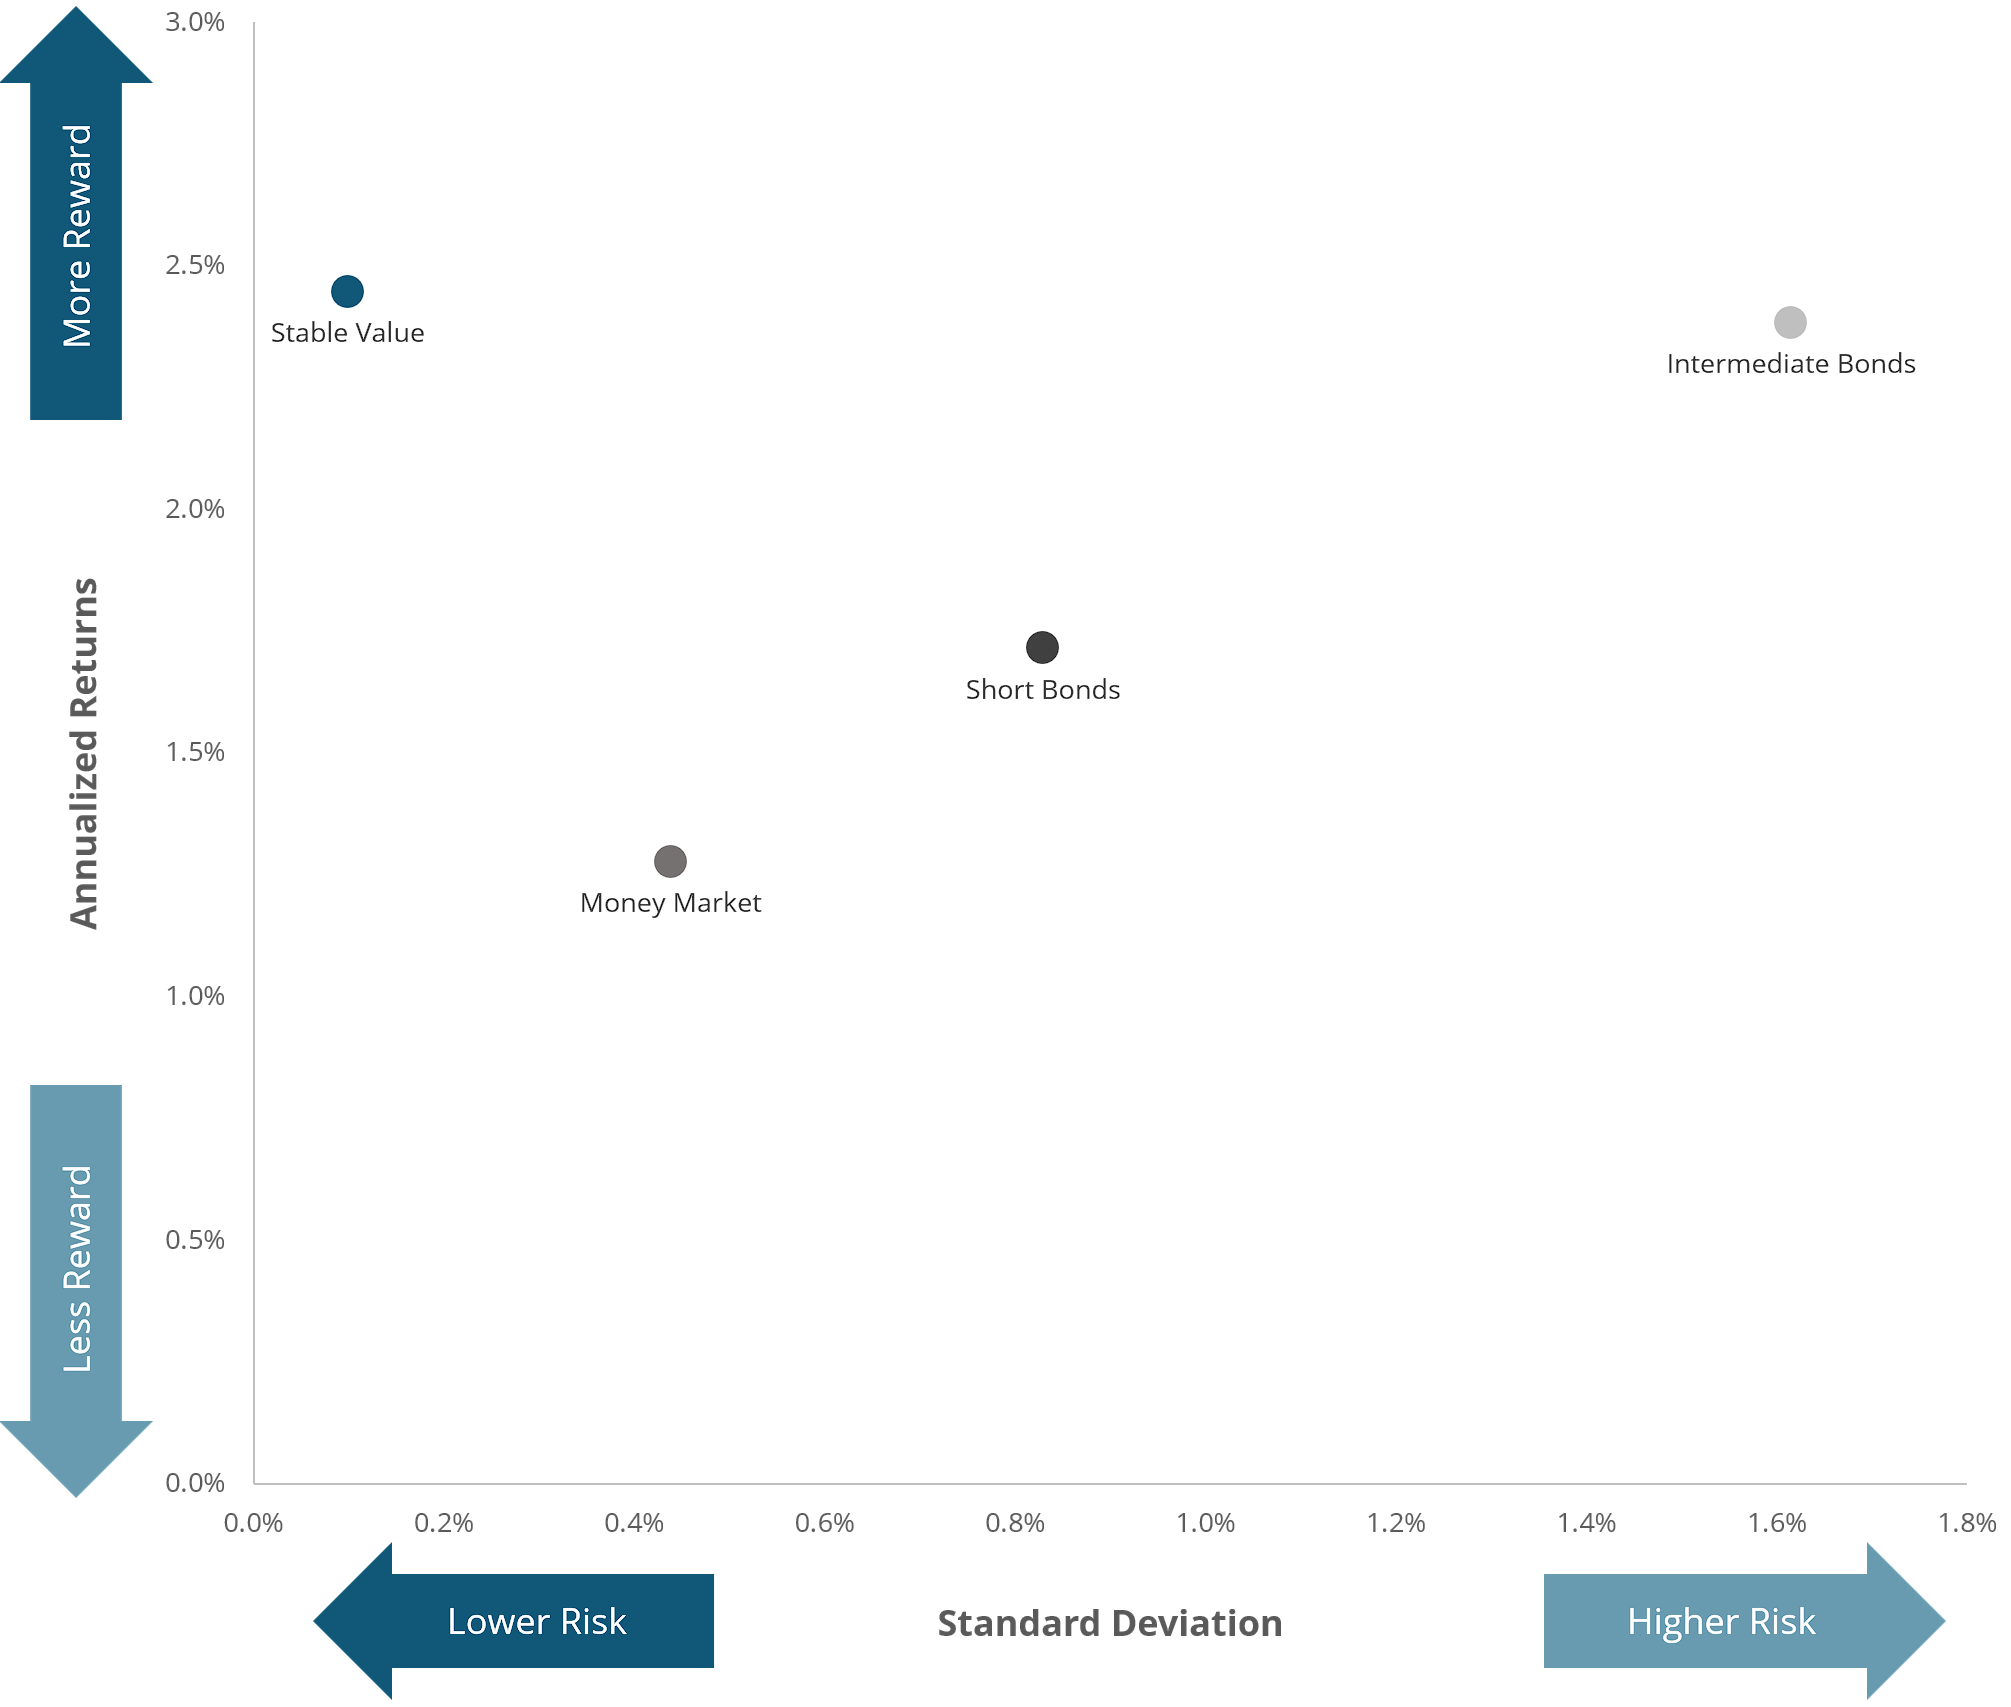
Stable value funds provide bond-like returns with exceptionally low volatility, which provides investors with an attractive risk/return profile.
15 Year Risk Vs Return as of 12/31/2025
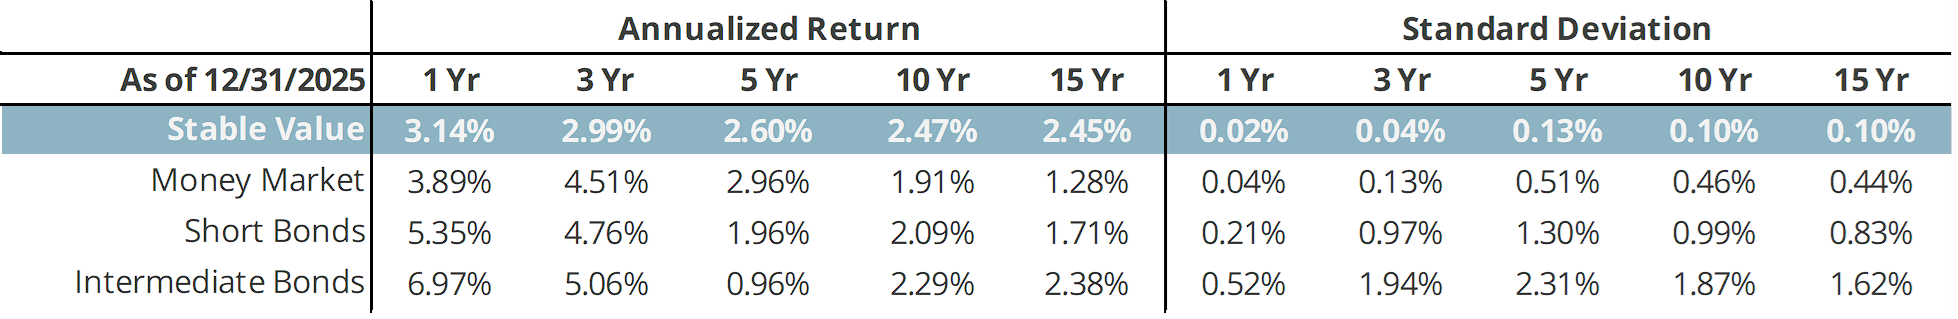
Shown another way, the table below illustrates the relative risk (as measured by standard deviation) and gross returns of stable value, money market, intermediate bonds, and stocks over time. The returns for stable value are similar to intermediate bonds but the volatility is the lowest of all asset classes shown. This results in a very attractive risk/return profile highlighting that stable value has historically been successful delivering on its objectives.
To learn more, read What Makes Stable Value Attractive
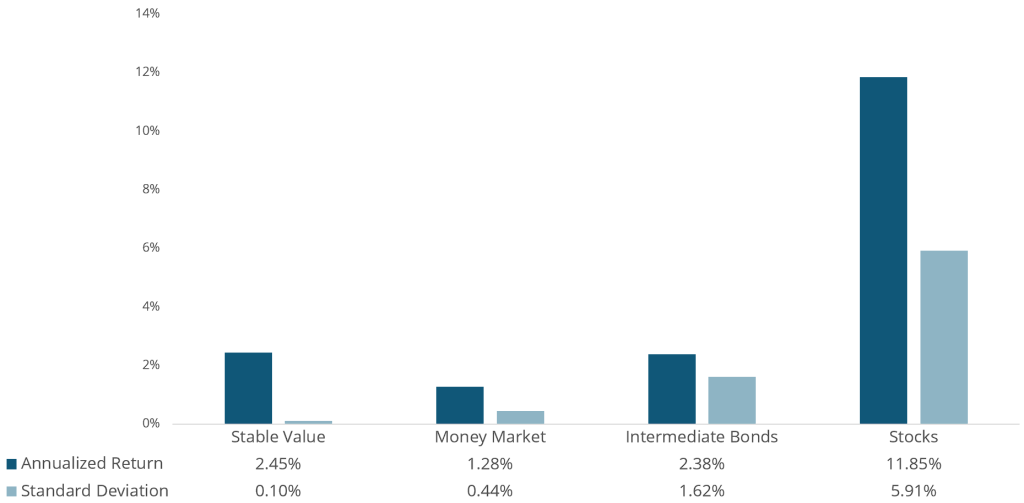
How Stable Value Stacks Up
15 Year Risk/Return as of 12/31/2025
To learn more, read the Stable Value FAQ
Volatility of Quarterly Returns
Quarterly Returns, 12/31/1989 – 12/31/2025
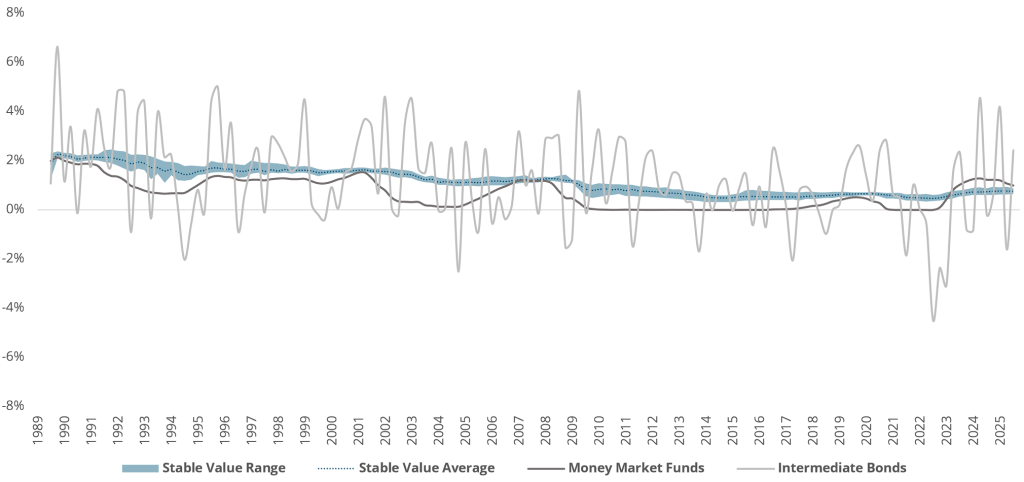
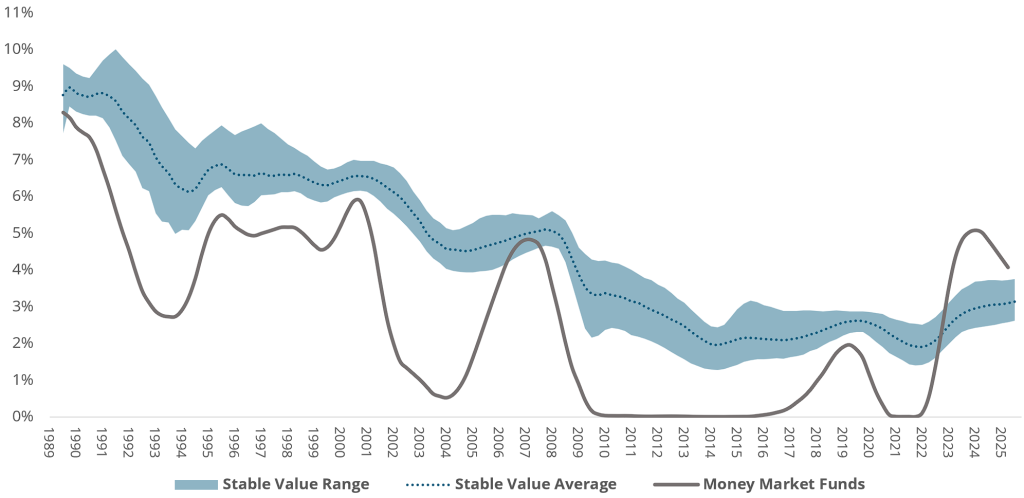
Stable Value Vs Money Market Funds
Rolling 12-Month Returns, 12/31/1989 – 12/31/2025
Growth of a Dollar
While the volatility is similar to money market funds, the growth of a dollar over the same period is comparable to intermediate bonds.
12/31/1989 – 12/31/2025

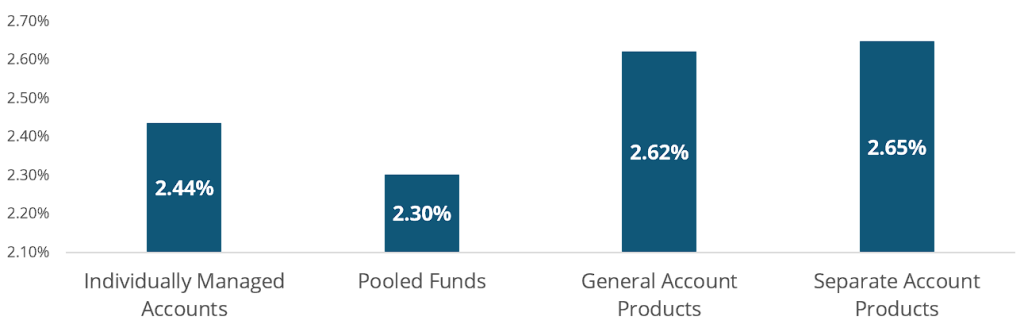
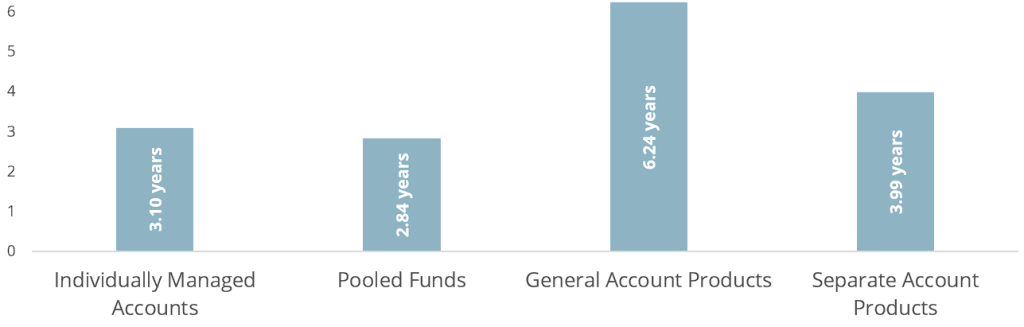
Performance & Duration1 by Segment
Stable value has four types of funds: individually managed accounts, pooled funds, insurance company general accounts, and insurance company separate accounts. Each type of stable value fund has different characteristics and it is up to the plan sponsor to decide which type is best suited to meet their plan’s needs. However, no matter the type of fund, all have a contractual element that protect against interest rate volatility in order to provide plan participants with safety, liquidity, and attractive returns.
Stable Value Average Annualized Crediting Rates
3/31/2015 – 12/31/2025
Stable Value Average Modified Duration
3/31/2015 – 12/31/2025
To learn more, read the Guide to Stable Value Market Segments
Footnotes
- SVIA Stable Value Quarterly Characteristics Survey for 4Q2025
Definitions
“Stable Value” is represented as a composite of the historical returns derived from data collected by the SVIA for its four stable value market segments (individually managed accounts, pooled funds, insurance company general accounts, and insurance company separate accounts). Historical return data is presented as both a range (with the top and bottom deciles removed) and as an average. Data from 1989 to 2008 was collected from stable value managers to form a composite for use in research conducted by David Babbel and Miguel Herce, and data from 2008 to present is sourced from the SVIA’s Quarterly Characteristics Survey with the period from 2008 to 2015 derived from reported crediting rate data. Returns are gross of stable value management fees but net of fees necessary to deliver the product, such as stable value wrap, third party fixed income management, trust, custody, and fund administrative fees. This composite is composed of varying types of stable value products and, as such, should not be used as a comparison to a specific product.
“Money Market” is a simulation of money market returns from the iMoneyNet MFR Money Funds Index. Returns illustrated are gross before any fees.
”Intermediate Bonds” is a simulation of market value bond fund returns from the Barclays Intermediate Government/Credit Bond Index. Returns illustrated are gross before any fees.
“Stocks” is the S&P 500 Index with dividends reinvested: a widely used barometer of U.S. stock market performance; as a market-weighted index of leading companies in leading industries, it is dominated by large-capitalization companies. Returns illustrated are gross before any fees.
“Short Bonds” is a simulation of market value bond fund returns from the Barclays Capital U.S. 1-3 Year Government/Credit Bond Index. Returns illustrated are gross before any fees.