Introduction
Many have theorized about how stable value would perform in a rapidly rising interest rate environment. The rapid rise in short-term interest rates since March of 2022 is the largest increase in rates since the 1980s and provides data to test these theories. As anticipated, money market funds have provided more favorable rates in the short run. Even though stable value may lag for now, history shows, and we expect, that stable value crediting rates will more gradually adjust to the higher rate environment with minimal volatility along the way.
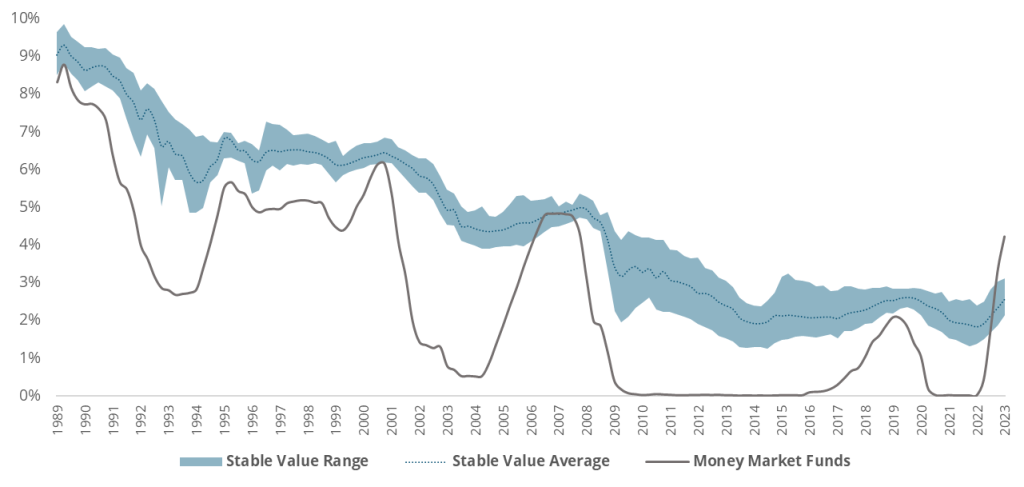
Following Market Interest Rates… With a Lag
“The crediting rate of stable value funds generally follow market interest rate trends (as rates both rise and fall), but with a lag.” (Berg. D, Gage, N. & Schuster, T. (2019). Stable Value and Rising Interest Rates. Stable Value Investment Association.) While some of the biggest criticisms against stable value that we’ve seen this market cycle are that stable value crediting rates lag market conditions and money market rates, this behavior was both anticipated and by design.
As demonstrated in the composite return series below, stable value product returns are designed to follow market interest rate trends with a lag. Perhaps more importantly, stable value is also designed to provide greater consistency of returns than money market funds. While money market funds are enjoying a more attractive rate in the short run due to the rapid increase in short-term interest rates and the current inverted yield curve environment, stable value continues to provide a reliable and consistent participant experience.
Stable Value vs Money Market
Curve Inversion
The 525 basis point increase in the Federal Funds (“Fed Funds”) target rate from March 2022 through July 2023 has led to a meaningful inversion in the yield curve and is the primary reason why money market funds currently enjoy a more attractive rate. Although this is the most significant curve inversion in recent history, this is not the only one, so we can look at historical data to help inform how long the inversion can be expected to last.
Using monthly averages of the 5-year Treasury rate compared to the Fed Funds effective rate as a measure of curve inversions, there have been 20 inversions since 1962. The two longest inversions each lasted 22 months, the first from March of 1973 to December of 1974 and the second from September of 1978 to June of 1980. The curve inversions during these 20 past periods lasted an average of 8.45 months, and the current curve inversion, which began in December of 2022, has persisted for 9 months as of the time this article was released. History suggests that this, too, shall pass likely within what most plan sponsors would characterize as the short run.
Where Does Stable Value Fit Today?
For the plan sponsor that is seeking a strategic, long-term view, stable value fits in fund line-ups that seek:
- Principal protection
- Consistent returns in-line with intermediate-term bonds, with exceptionally low return volatility
- Low correlation to other asset classes
- Liquidity for participant benefit payments
These guiding principles have not changed much for most plan sponsors, even as money market funds offer what is widely expected to be a temporarily higher rate. Plan sponsors understand that today’s market conditions are inherently fleeting, as a sustained inverted yield curve is unlikely to persist over time, and their participants have a much longer investment horizon.
Once the Fed reverses this rate hiking cycle, most plan sponsors anticipate a reversion to a more normalized yield curve, where stable value enjoys the advantages of additional yield associated with its ability to invest in longer maturity bonds and bonds with a credit spread that are generally not eligible investments in money market funds. History has shown that these differentiators produce a more attractive return for stable value than money market over medium to longer term time horizons, and that plan sponsors can, and will, continue to count on stable value through all types of market cycles.
Footnotes
“Stable Value” is represented as a composite of the historical returns derived from data collected by the SVIA for its four stable value market segments (individually managed accounts, pooled funds, insurance company general accounts, and insurance company separate accounts). Historical return data is presented as both a range (with the top and bottom deciles removed) and as an average. Data from 1989 to 2008 was collected from stable value managers to form a composite for use in research conducted by David Babbel and Miguel Herce, and data from 2008 to present is sourced from the SVIA’s Quarterly Characteristics Survey with the period from 2008 to 2015 derived from reported crediting rate data. Returns are gross of stable value management fees but net of fees necessary to deliver the product, such as stable value wrap, third party fixed income management, trust, custody, and fund administrative fees. This composite is composed of varying types of stable value products and, as such, should not be used as a comparison to a specific product.
“Money Market” is a simulation of money market returns from the iMoneyNet MFR Money Funds Index. Returns illustrated are gross before any fees.