Stable value managers are frequently asked how stable value funds will respond in a rapidly rising interest rate environment. Some consultants and plan sponsors seem to fear that today’s historically low interest rate environment will disadvantage stable value funds should rates rise. To address this fear, it is helpful to look at what makes this period of time unique and evaluate how stable value has performed under past interest rate challenges.(i)
The Great Recession is a very historic time. Interest rates have never been so low, but the Federal Reserve has not formally announced any plans to sustain these low rates for the next two years. With the Federal Reserve providing an early warning for rising rates and stable value funds’ strong fundamentals, stable value is well positioned to respond to this challenge. Market-value to contract-value ratios continue to be strong at 104.49 percent, crediting rates average 2.73 percent, overall credit quality for stable value portfolios continues to be AA to AA+, and portfolio durations average 2.83 years.
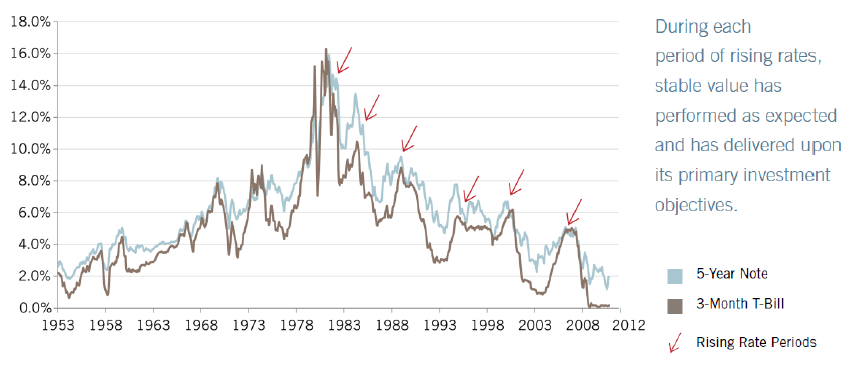
Figure 1: An Historical Review of Interest Rates
Short and Intermediate Rates Since 1953
Historical Backdrop
In the late 1970s and early 1980s, the U.S. economy was plagued by chronically high inflation and poor economic growth. The Fed, under then-chairman Paul Volcker, successfully brought down the inflation rate from a peak of 13.6 percent through a painfully restrictive monetary policy–laying the groundwork for almost three decades of declining interest rates and the secular bull market in bond prices (See Figure 1).
More recently, Ben Bernanke’s Fed implemented unprecedented accommodative monetary policy. That, coupled with increasing amounts of debt on the nation’s balance sheet and bouts of inflationary pressure, has raised concern among investors that we may begin entering a sustained period of rising interest rates and a secular bear market in bonds. Indeed, with the current level of short-term interest rates at or near historic lows, it would appear rates have nowhere to go but higher. As a result, investors are assessing the impact rising inflation and interest rates would have on asset returns, including stable value.
Rising Rates Not New to Stable Value
A rising rate environment could present an issue to a stable value portfolio if the rate increases are significantly above the portfolio’s crediting rate.
In that context, it is worth pointing out that the Fed generally implements shifts in the federal funds rate, which historically has used to control short term interest rates, in 25-basis-point increments following scheduled Federal Open Market Committee meetings. With the fed funds rate at nearly zero, it would likely take over 10 increases of 25 basis points each just to bring money market fund yields into equilibrium with current stable value portfolio crediting rates.
Throughout stable value’s history, there have been six full interest rate cycles, which have been characterized by increasing inflationary pressures, restrictive monetary policy, and a rise in the level of interest rates.
During each of these periods of rising rates, the product performed as expected and delivered on its primary investment objectives.
Stable Value and Inverted Curves
The yield curve has been positively sloped the majority of the time due to investors requiring a maturity risk premium. However, there are periods when the yield curve becomes “inverted”–meaning short-term rates exceed intermediate and long-term rates. In this environment, money markets may become a more attractive investment alternative, at least in the short run, relative to other conservative options such as stable value.
Since 1953, there have been 10 instances of yield curve inversion as measured by the slope of the UST 3-month Bills versus UST 5-year Notes. The typical inversion lasted 5.5 months, with an average inversion of 60 basis points. Over nearly six decades, there have only been 55 months (or 8 percent of the time) when the yield curve has been inverted. The number of curve inversions correlates closely with Fed policy and the number of economic cycles the U.S. economy has been through. Inversions tend to be short because they are driven by Fed actions to cool inflationary pressures by making short-term borrowing more expensive. Once the economy slows, the Fed reverses the process, and the yield curve returns to its normal configuration.
While there have been instances over the past 30-plus years when money markets have outperformed stable value, these periods have been relatively short lived. A review of yield curves over the last half century suggests a very small probability of money markets outperforming stable value on a consistent, long-term basis.
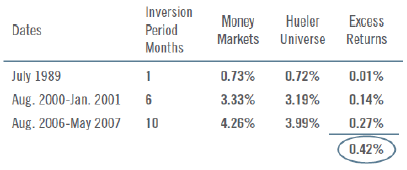
Over the last 25 years, the yield curve has been inverted three times for a total of 17 months (See Table 1). Comparing money market returns with the Hueler Pooled Fund Universe returns shows that the total, cumulative excess returns generated by money markets during these inversion months was just 0.42 percent (See Table 2). In contrast, the cumulative outperformance of the Hueler Universe relative to money markets since 1986 has been 77 percent higher for the same dollar amount invested over that period.
Table 1: Periods of Inverted Yield Curves(ii)
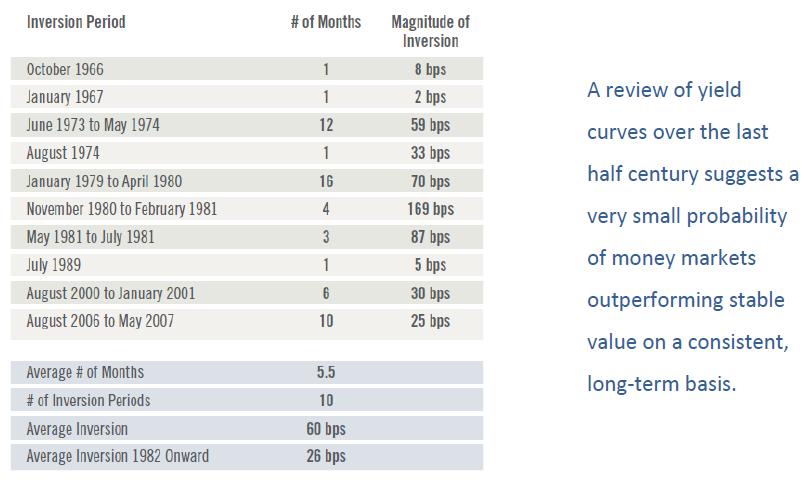
Table 2: Total Returns of Money Markets and Stable Value Pooled Funds During Periods of Inverted Yield Curves
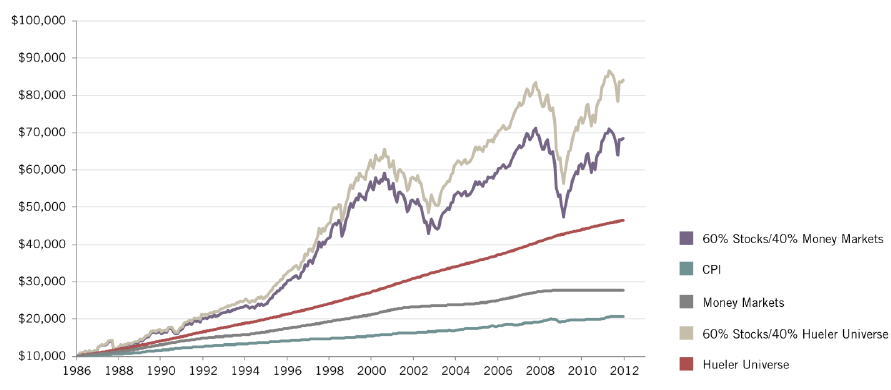
Rising interest rates, yield curve inversions, and other market dislocations will continue to come and go in the future, but the fundamental proposition of stable value–namely to provide principal preservation while delivering returns comparable to those of short/intermediate bonds with limited volatility–will not change. For almost 40 years (and since the dawn of the Hueler Universe), stable value funds have delivered principal preservation and steady, consistent, conservative returns. Focusing solely on return for a specific period minimizes what stable value delivers to plan participants: diversification benefits since it has the least correlation to equities, the ability to provide an intermediate bond-like return without the volatility, and principal preservation (See Figure 2).
Figure 2: Growth of $10,000: Performance of Stable Value vs Money Market
i SVIA Stable Value Quarterly Stable Value Funds Characteristics Survey covering 24 managers with stable value assets of $441 billion for the First Quarter, 2012.
ii Calculations are derived from H.15 data available from the Federal Reserve, (http://www.federalreserve.gov/releases/h15/data.htm). Inversion periods are defined as periods when yields on the 5-year Treasuries were less than the 3-Month T-Bill.